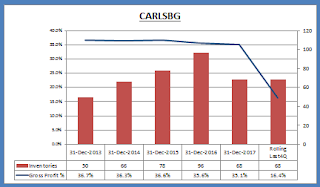
Gross Profit % vs Inventory
I have added a chart to compare the Gross Profit % and Total Inventory. Both are related!
If a company gives higher gross profit %, please do not be so excited!
Look at the Total Inventory first.
Let have a look how to calculate Gross Profit %.
Total Revenue minus manufacturing cost is known as Gross Profit
Gross Profit divides by Total Revenue is Gross Profit Margin %
Manufacturing cost has main 2 cost factors, named Fixed Cost and Variable Cost
Fixed Cost is not relavent to number of of finished goods, whether the company produces one unit or 1000 units, the fixed cost per unit is same.
However, variable cost is depend on number of finished good. The higher the number of finished goods the cheaper the variable cost per unit. This known as economic of scale.
Therefore in order to have higher Gross Profit Margin %, the company always tries to produce higher numbers of finished good. The shortfall is the company may not able to sell all the finished goods.
If the finished goods cannot be sell, this caused higher inventory!
Higher inventory give huge impacts on cash flow! At the end, the company may need to write it off or sell in much discounted price.
Therefore if sudden a company has higher Gross Profit %, exam its inventory level FIRST, and its net operating cash flow!
Look into another side, if a company with higher Gross Profit % and lower inventory, it is a good sign. More demand from customers.
if lower Gross Profit and lower Inventory, most likely doing promotion to clear stock...
If lower Gross Profit and Higher Inventory, most likely hard to sell the goods....
Below are some examples for your reference.
BAT, CARLSBG, DLADY, F&N, HEIM, NESTLE


No comments:
Post a Comment